Overview
The HEAN RCC Team generates three indices representing neighborhood deprivation, which are shared nationwide through the UCSF Health Atlas.
Access the UCSF Health Atlas.
UCSF Health Atlas
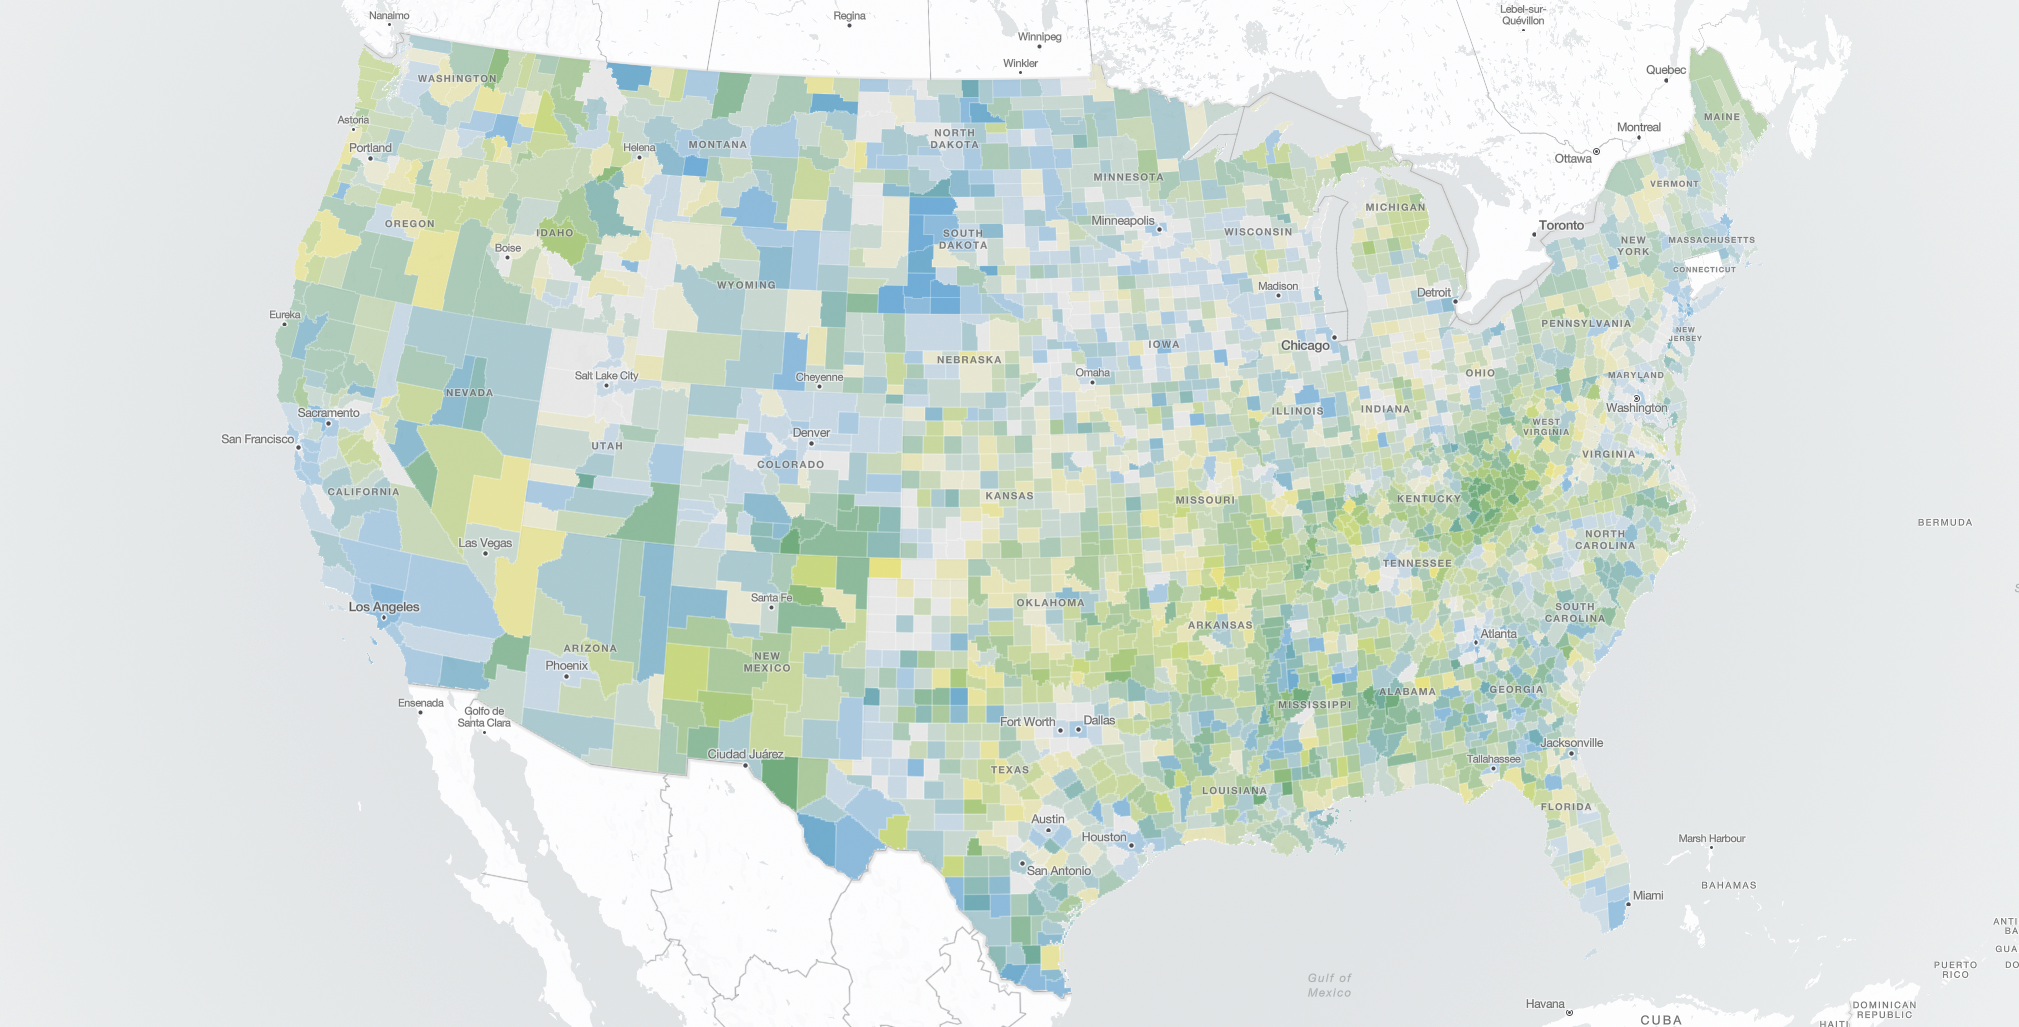
When it comes to health, place matters. The UCSF Health Atlas is an interactive mapping tool that can be used to explore neighborhood-level characteristics to see how they relate at a population level. Data for the Health Atlas comes from over 20 publicly available datasets, such as the American Community Survey, CDC PLACES, and EPA Environmental Justice Screen. Users can explore and compare over 120 demographic, socioeconomic, neighborhood, environmental, and health/healthcare-related variables.
Originally launched in 2020 with a focus on California, the UCSF Health Atlas expanded in 2024 to include data from all 50 states in the U.S., the District of Columbia, and Puerto Rico and new variables related to climate & segregation.
- Researchers can find a centralized hub of comprehensive, publicly available social determinants of health data that can be easily customized into impactful visuals for intervention development, publications, presentations, and more.
- Policymakers are offered insights into the needs and context of any region with customizable area selection at a variety of levels, from state to congressional district to neighborhood.
- Community members visualize local health and environmental factors with this user-friendly tool to advocate for their specific needs.
- Teachers & Students can use mapping features to teach and learn about place-based factors of health and generate research questions for grant proposals.
Tool
Data sources
- American Community Survey (ACS) 5-year data 2019 (2015-2019): 2010 Census Shapes
- ACS 5-year data 2022 (2018-2022): 2020 Census Shapes
Types of indices
- Bemanian Beyer Local Exposure and Isolation metric (LEx/Is)
- For the interaction between non-Hispanic White and non-Hispanic Black
- For the interaction between non-Hispanic White and non-Hispanic Asian
- For the interaction between non-Hispanic White and Hispanic
- Combined income and race/ethnicityIndex of Concentration at the Extremes (ICE)
- For the comparison of non-Hispanic White in the 80th income percentile vs. Black alone (including Hispanic) in the 20th income percentile
- For the comparison of non-Hispanic White in the 80th income percentile vs. Hispanic in the 20th income percentile
- For the comparison of non-Hispanic White in the 80th income percentile vs. Asian alone (including Hispanic) in the 20th income percentile
- Powell-Wiley Neighborhood Deprivation Index (PW NDI)
Available geographic levels
- LEx/Is
- Census Tract vs. County
- Congressional District vs. State
- County vs. State
- Public Use Microdata Area (PUMA) vs. State
- ICE and PW NDI: Census Tract, ZIP Code Tabulation Area (ZCTA), State, County, Core-Based Statistical Area (CBSA), Congressional District, and PUMA

Bureau UC. Understanding Geographic Relationships: Counties, Places, Tracts and More. The United States Census Bureau.
How to interpret each index
You can see that the distribution of the selected variable is presented with different color shades according to the quintile of the index. The brightest color indicates the lowest quintile, whereas the darkest color indicates the highest quintile. You can select up to two properties for demonstration.
- The LEx/Is measures the local segregation using the probability of the interaction between two individuals living in a specific small geographic area (e.g., Census tract) of either different or same racial/ethnic subgroup relative to a large geographic area (e.g., county).[2]
- The value is standardized by the logit transformation and centering against the expected value that all subgroups live evenly across the large geographic area, ranging from negative infinity to positive infinity.[1]
- A LEx/Is value of 0 indicates that the estimated probability of the interaction between two individuals from the racial/ethnic subgroups within the small geographic area is equal to the expected probability if the larger geographic area were perfectly mixed.
- To obtain the odds ratio of the interaction between the two racial/ethnic subgroups in the small geographic area relative to the large geographic area, exponentiate the LEx/Is value.[1]
- For the different racial/ethnic subgroup LEx/Is, non-Hispanic or Latino White alone was compared to 3 of the most populous subgroups - 1) non-Hispanic or Latino Black or African American alone, 2) non-Hispanic or Latino Asian alone, and 3) Hispanic or Latino.
- LEx/Is value = 0
- The estimated probability of the interaction between two people of the selected subgroups within the small geographic area is equal to the expected probability if they are perfectly mixed in the large geographic area.
- The degree of segregation of two race/ethnicity subgroups from each other in the small geographic area is the same as that in the large geographic area.
- LEx/Is value > 0
- The estimated probability of the interaction between two people of the selected subgroups within the small geographic area is greater than the expected probability if they are perfectly mixed in the large geographic area.
- The two race/ethnic subgroups are less segregated from each other in the small geographic area than in the large geographic area.
- LEx/Is value < 0
- The estimated probability of the interaction between two people of the selected subgroups within the small geographic area is less than the expected probability if they are perfectly mixed in the large geographic area.
- The two race/ethnic subgroups are more segregated from each other in the small geographic area than in the large geographic area.
- LEx/Is value = 0
- The ICE was originally developed for residential segregation research (Massey 2001) and later used as a spatial social polarization of public health outcomes (Krieger et al. 2016).[3][4]
- The ICE shows the extent to which a specific geographic level’s residents are concentrated into groups at the extremes of deprivation and privilege.
- The ICE is derived from the differences between the number of the least and the most deprived people in the geographic area divided by the total population in that geographic area.[1]
- While we can generate the ICEs of income, race/ethnicity, education, or a combination of them, the combined income and race/ethnicity ICE are provided according to racial/ethnic subgroups (Black, Hispanic, Non-Hispanic White); the least deprived group is non-Hispanic White in 80th income percentile, and the most deprived groups are Black alone (including Hispanic) , Hispanic alone, or Asian alone (including Hispanic) in 20th income percentile.[1]
Non-Hispanic White in the 80th income percentile vs. Black alone (including Hispanic) in the 20th income percentile
The difference between those who identify themselves as non-Hispanic White in the 80th income percentile vs. Black alone (including Hispanic) in the 20th income percentile among the total population measured for the household income in the corresponding geographic area
Non-Hispanic White in the 80th income percentile vs. Hispanic in the 20th income percentile
The difference between those who identify themselves as non-Hispanic White in the 80th income percentile vs. Hispanic in the 20th income percentile among the total population measured for the household income in the corresponding geographic area
Non-Hispanic White in the 80th income percentile vs. Asian alone (including Hispanic) in the 20th income percentile
The difference between those who identify themselves as non-Hispanic White in the 80th income percentile vs. Asian alone (including Hispanic) in the 20th income percentile among the total population measured for the household income in the corresponding geographic area
- For the income level, the household income for the past 12 months was used, and the income values that were 2019 or 2022 inflation-adjusted were used to decide the 80th and 20th income percentiles.
- The ICE ranges from –1 to 1
- ICE = 1
- All residents are in the most privileged group
- ICE = -1
- All residents are in the most deprived group
- ICE = 0
- The area is not dominated by extreme concentrations of either of the two groups
- None of the residents are in the most privileged or most deprived categories
- An equal number of persons are in the most privileged and most deprived categories
- The area is not dominated by extreme concentrations of either of the two groups
- ICE = 1
- PW NDI was created using a statistical method to determine the main information components from 13 income, education, employment, and resource measures.[5]
- Higher PW NDI values indicate greater neighborhood deprivation (fewer resources and opportunities), while lower values indicate lower neighborhood deprivation (greater resources and opportunities).
- Median household income (ACS Table: B19013)
- Percent of households receiving dividends, interest, or rental income (B19054)
- Percent of households receiving public assistance (B19058)
- Median home value (B25077)
- Percent in a management, business, science, or arts occupation (C24060)
- Percent of households that are female-headed with any children under 18 years (B11005)
- Percent of housing units that are owner-occupied (DP04)
- Percent of households without a telephone (DP04)
- Percent of households without complete plumbing facilities (DP04)
- Percent with a high school degree or higher (population 25 years and over) (S1501)
- Percent with a college degree or higher (population 25 years and over) (S1501)
- Percent of families with incomes below the poverty level (S1702)
- Percent unemployed (S2301)
Citation
UCSF Health Atlas. University of California, San Francisco School of Medicine Dean’s Office of Population Health and Health Equity, 2024. Accessed from: www.healthatlas.ucsf.edu
References
[1] Maintainer I, Buller. Package “Ndi” Title Neighborhood Deprivation Indices.; 2024. https://cran.r-project.org/web/packages/ndi/ndi.pdf
[2] Bemanian A, Beyer KM. Measures Matter: The Local Exposure/Isolation (LEx/Is) Metrics and Relationships between Local-Level Segregation and Breast Cancer Survival. Cancer Epidemiol Biomarkers Prev. 2017;26(4):516-524. doi:10.1158/1055-9965.EPI-16-0926
[3] Krieger N, Waterman PD, Spasojevic J, Li W, Maduro G, Van Wye G. Public Health Monitoring of Privilege and Deprivation With the Index of Concentration at the Extremes. Am J Public Health. 2016;106(2):256-263. doi:10.2105/AJPH.2015.302955
[4] Feldman JM, Waterman PD, Coull BA, Krieger N. Spatial social polarisation: using the Index of Concentration at the Extremes jointly for income and race/ethnicity to analyse risk of hypertension. J Epidemiol Community Health. 2015;69(12):1199-1207. doi:10.1136/jech-2015-205728
[5] Andrews MR, Tamura K, Claudel SE, Xu S, Ceasar JN, Collins BS, Langerman S, Mitchell VM, Baumer Y, Powell-Wiley TM. Geospatial Analysis of Neighborhood Deprivation Index (NDI) for the United States by County. J Maps. 2020;16(1):101-112. doi: 10.1080/17445647.2020.1750066. Epub 2020 Apr 15. PMID: 32855653; PMCID: PMC7447192.